Numbers Everywhere!! IF you have been trying to make sense of the Ultrasonic Thickness data that came from your boiler inspections, keep reading.
The industrial number-crunching database you've been waiting for has arrived.
INTRODUCTION
- Introducing the Boiler module of the TCRI Technical Database System (TDS)
- The software promotes higher quality inspetions of boilers by imaging the UT data that is collected by the NDT lab DURING the shutdown
- TCRI is the original author of the unique concept. As a third party, we have been analyzing UT data since mid 1984. Third party means TCRI works for the mill engineer, not the NDT lab.
PURPOSE OF THE TDS
- To standardize and upgrade the quality of UT boiler inspections that are preformed by various NDT labs.
- To perform as a third party to evaluate the quality of the UT data that is collected by the NDT lab while the boiler is down.
- To be installed at the mill site and used as a database by mill engineer to perform maintenance and budget planning between shutdowns.
TDS CHARACTERISTICS
- The TDS is a user friendly environment that allows access to thousands of separate files or UT data points without having to know the file names. The mill engineer can interact with the TDS using boiler terms, not computer terms.
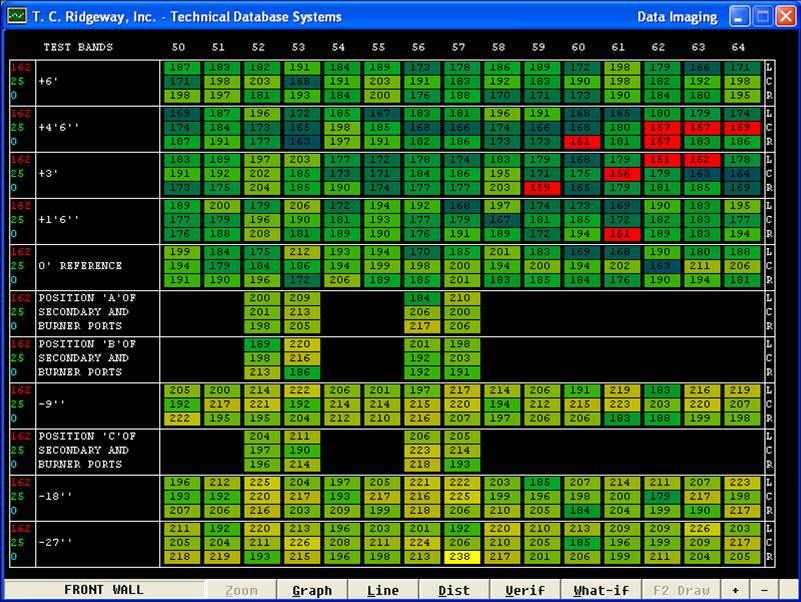
- Generates a color coded report which enables easy evaluation of the UT data. When a boiler tube becomes thinner, the color becomes darker.
PRIMARY OBJECTIVES OF REPORT
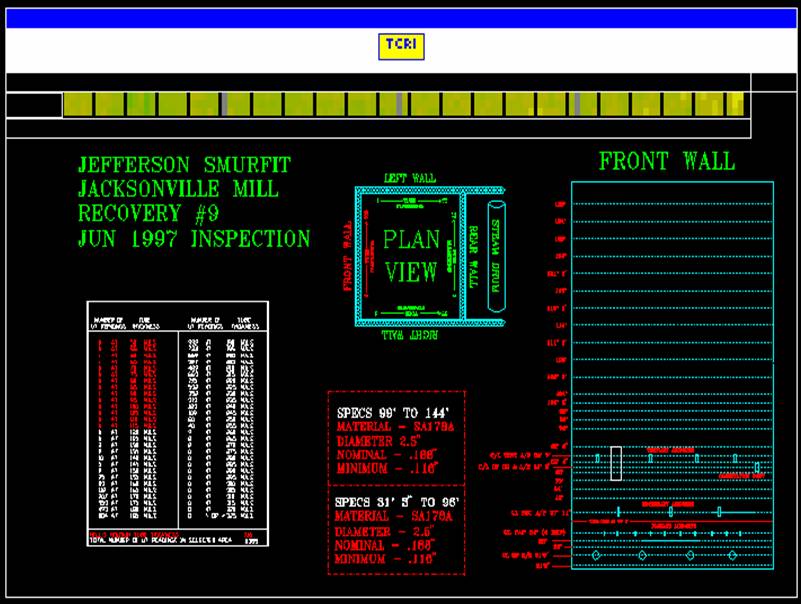
- The UT data and technical drawings for each boiler section is presented in the proper relative position. The color print looks like a boiler wall.
- All of the UT readings are displayed: Left, Center and Right positions on the tube.
- Each UT reading is assigend a thickness legend letter in order to get all of the data on one print.
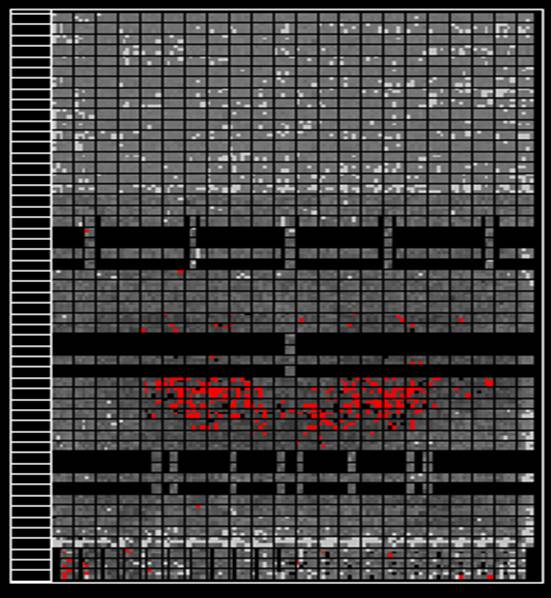
- The color imaging print is known as the "Static Image" and reflects true wear patterns and/or erroneous data.
- Each UT reading is assigned a color which reveals it's relation to the minimum allowable thickness value. The darker the color of the reading, the closer it is to the minimum allowable value. Any UT reading at or below minimum value is red.
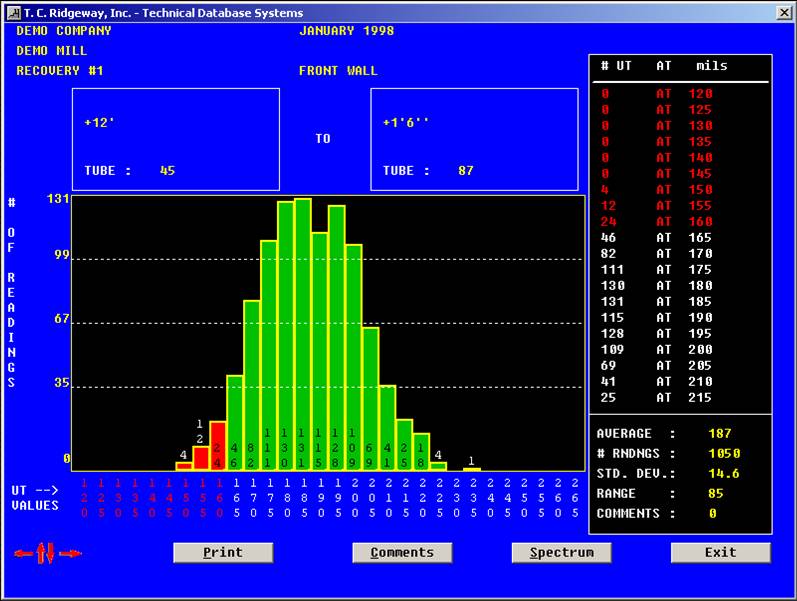
- The distribution box on each print gives a concise summary of the mumber of UT readings at different thickness values.
The inspection orientation drawings that reflect where the data was collected are custom designed for each boiler section.
NDT technician names are attached to each test band
- Technician accountability is achieved by tracking which technician inspected each test band. The test band name has a letter to the left of it which corresponds to a technician list at the top of the report. You know who did what! This is a big help when tracking down data quality problems during the inspection.
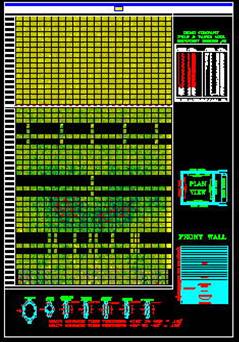
Static Images - Static Images graphically represent each boiler section. The darker colors, the closer the reading is to to minimum allowable thickness.
You can zoom in to view the data or create what-if scenarios
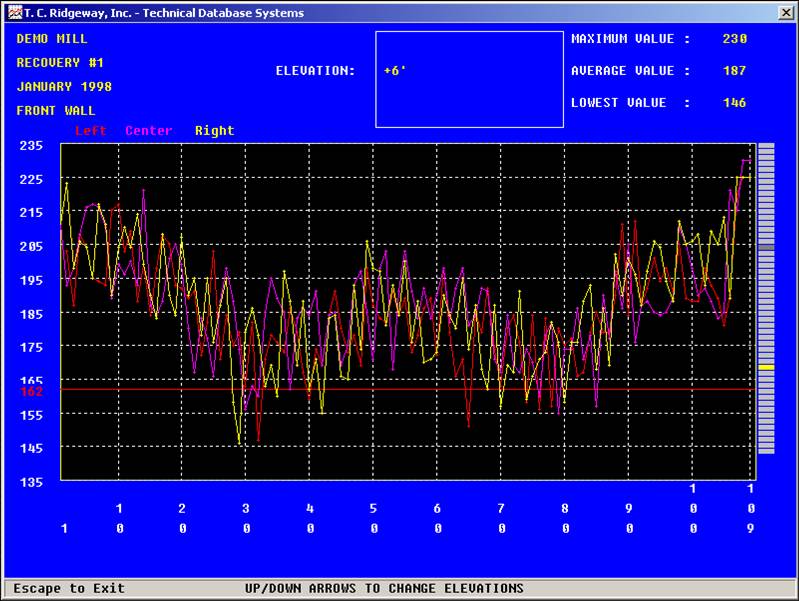
UT Inspecxtion Elevation line graphs from Static Image
Distribution of wear pattern
RECOVERY BOILER NEAR-DRUM INSPECTION
- If you have a recovery boiler there is a chance you have the near-drum tube thinning problem. Today the labs have the automated probes that gather literally millions of UT data points.
- The TDS takes those puzzle pieces and puts them together to form a picture.
MUD DRUM MACRO SCREEN -The macro view consist of all the tubes in the drum displayed simultaneously
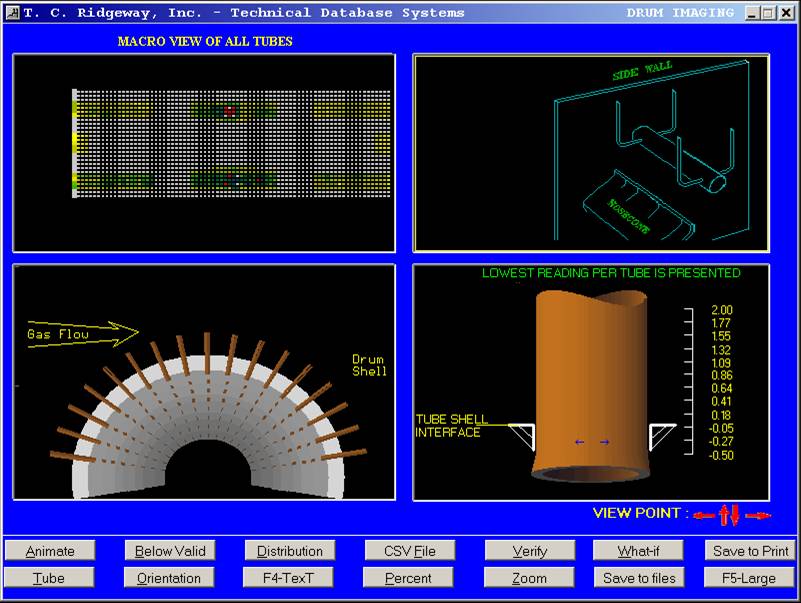
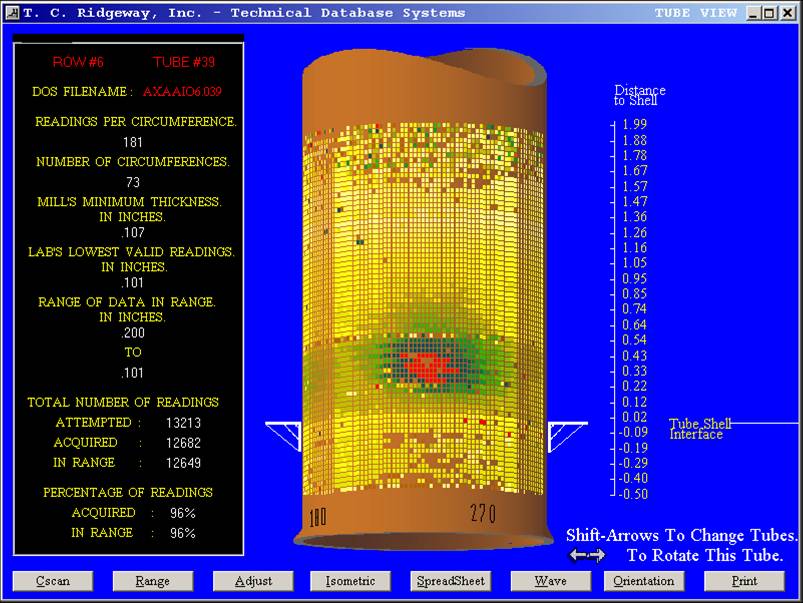
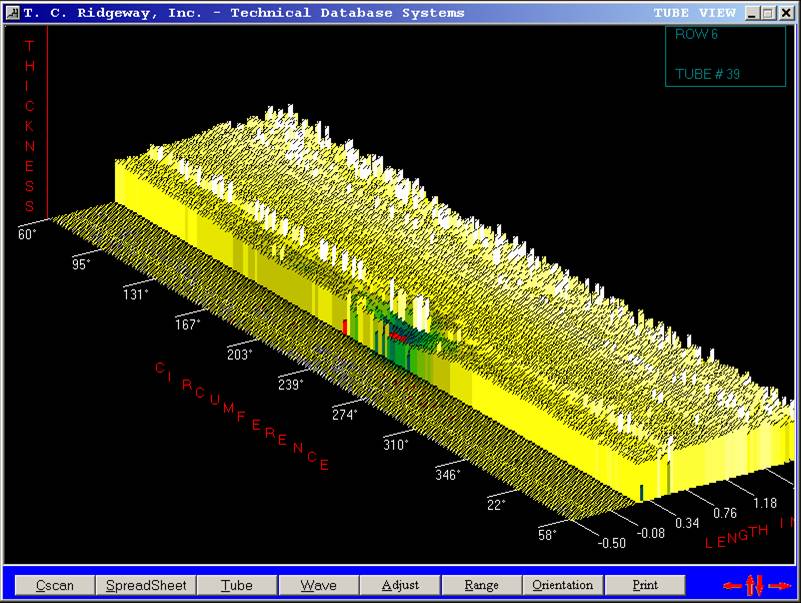
3-D Tube Screen - The UT data points are arranged and colored to form an image of the tube
Isometric Screen - Shows an external topographial cut-away view of the near drum corrosion
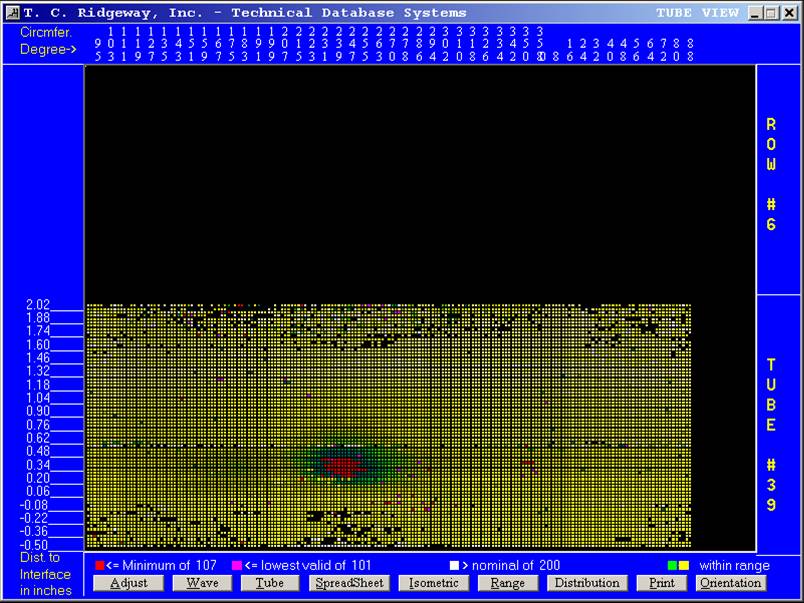
C-Scan Screen - When all of the data points are used, they show a near-drum corrosion pattern
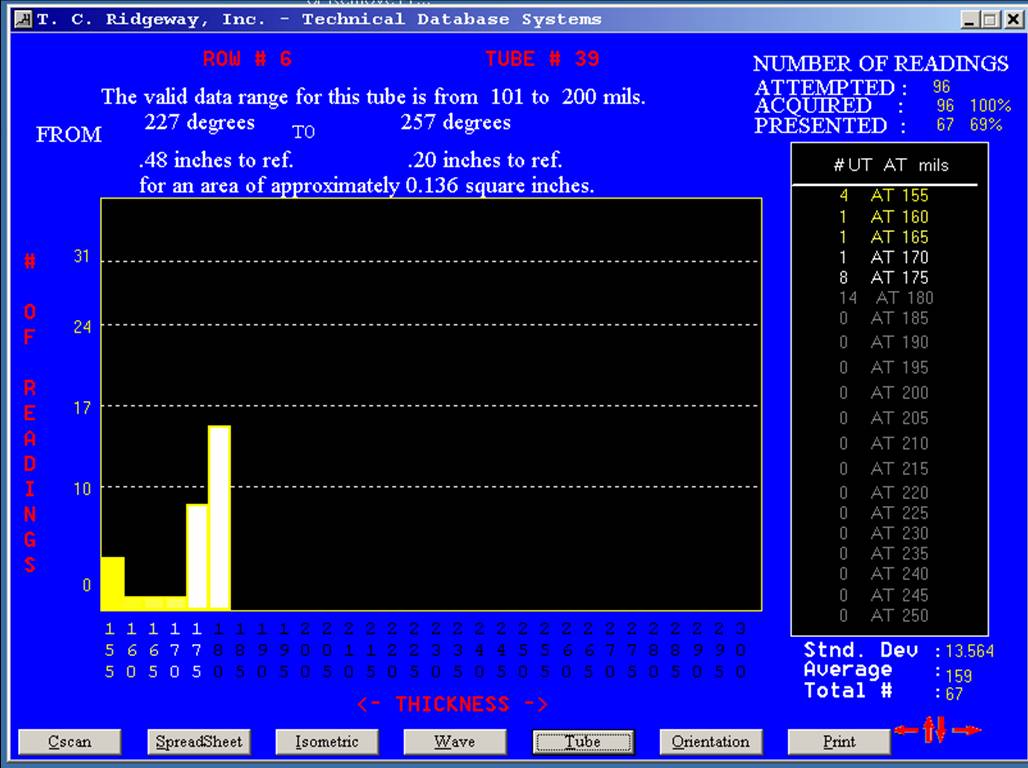
Wear Area Distribution Screen - If the below min wear area is small enough, the tube will not need plugging.
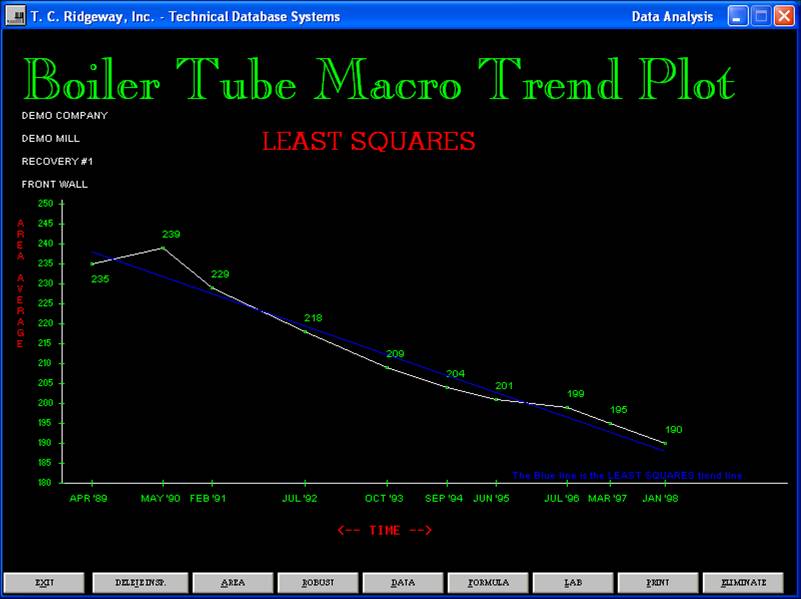
Secondary Objective of the TDS is tube thickness trending
- To submit every single location of the UT inspection to a trending algorithm known as the "Sum Of The Least Squares."
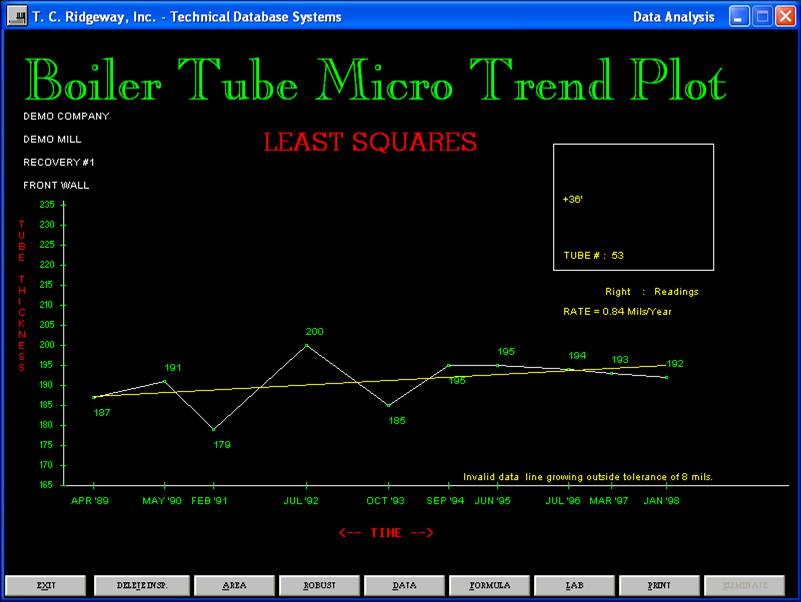
- The graph used is Thickness vs Time. The slope of the Least Squares line is the tube thickness "Rate of Change"
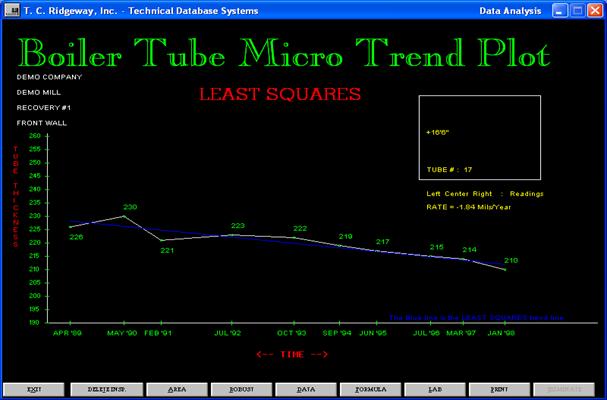
Least Squares Screen - This screen shows the trend line for a single UT inspection location
Micro Trend Information
Rate Images from Micro Trend Plots
- The Rate-of-Change for every single UT inspection location is calculated via the Least Squares formula. Then the rates are all displayed simultaneously to form the Rate Image.
- The Rate Image opens up a whole new way of analyzing UT data. You can "see" where the boiler is wearing the fastest.
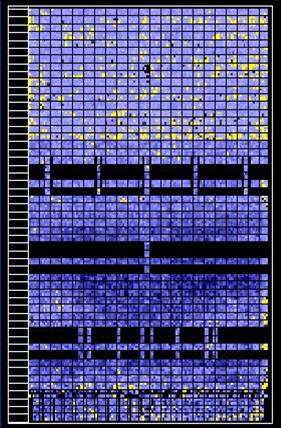
Rate Image
- The rates-of-change for all locations are displayed together and in the proper relative position to form the Rate Image
- Dark blue indicates the tubes are wearing fast.
- Light blue indicates the tubes are wearing slow.
- Yellow indicates invalid data.
Macro Trend Plots
- Because you can see the areas of higher wear, you know what to trend
- Simply create the window with your mouse
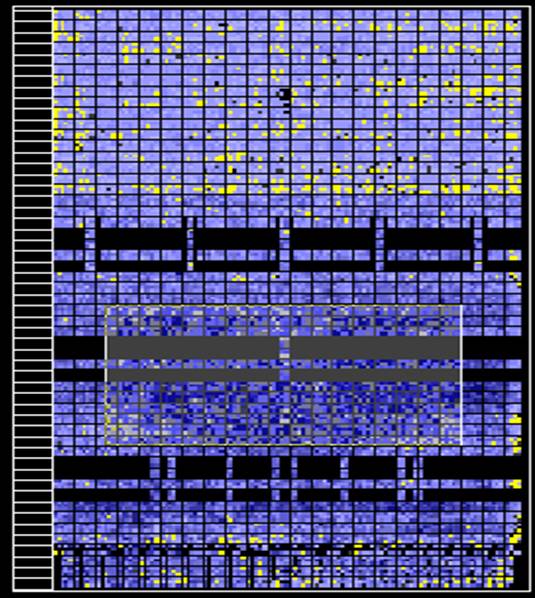
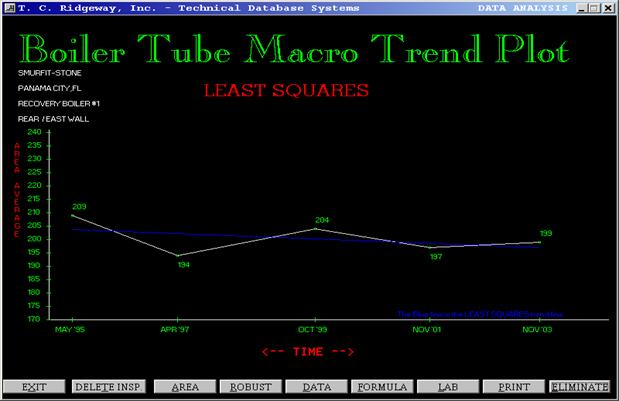
Macro Trend Plot Screen - This screen shows the trend line for the high wear rate area of the boiler section.
Macro Trend Information
Statistics per testband
- The TDS will also print the following from the Rate Image:
- The highest UT reading, the lowest reading, the rate of change and the number of years used to analyze each testband.
Yellow means invalid data?
- In order for the inspection location to be yellow on the Rate Image, two things must be true:
- The trend line must be positive, meaning the data is gettting thicker with time
- The thickness of the lowest reading on the trend line when compared to the highest reading on the trend line must be greater that the criteria established by the client (1 to 15 mils).
Inherent Inaccuracies of data - There are many known factors that effect the accuracy of boiler inspection data
- Because the Rate Image is so revealing, it is easy to see that UT data can sometimes be invalid. We had to define invalid data and then separate the valid data from the invalid.
- Valid data is data that has a small margin of error. Invalid data is data that has a large margin of error.
Trend line with a "small" margin of error
Trend line with a "large" margin of error
Filter Function
- If the data is in error to the degree the normal Rate Image is mostly yellow, the Filter Function may be helpful.
- The Filter Function can be employed if there were at least five inspection dates used to create the original Rate Image.
- This function evaluates the historical and current UT data for every inspection location to determine which UT reading causes the margin of error to be the greatest. The single reading is then disregarded and the rate of change is recalculated and displayed.
- The filtering process is repeated for every inspection location of the original Rate Image. Once complete, the normal Maco Trending can be preformed on the remaining Rate Image.
Two Standard Deviations Filter
- Another attempt to make some use of the historial data when the quality is in question.
- This type of data filtering eliminates any data that is outside of two Standard Deviations from the average of the body of data.
- This is done on each of the sets of UT data represented on the Least Squares line. The result is referred to as the Conditioned Line.
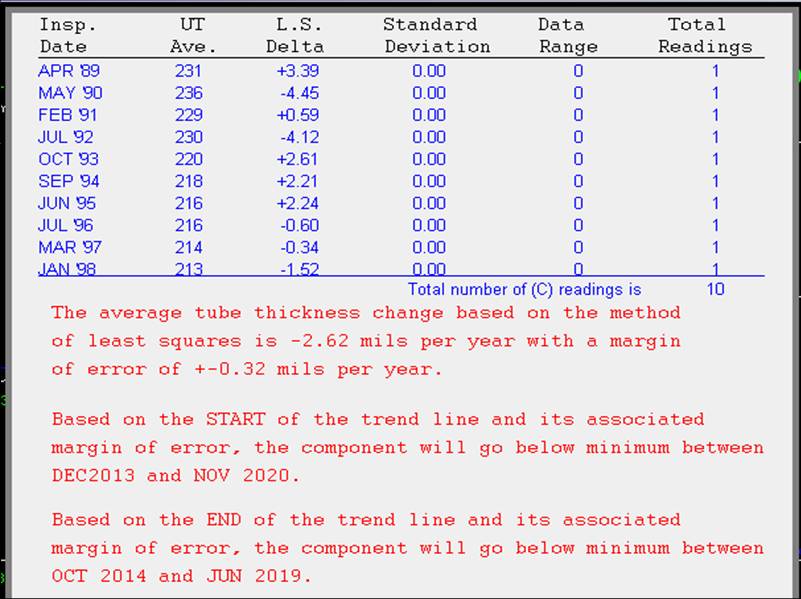
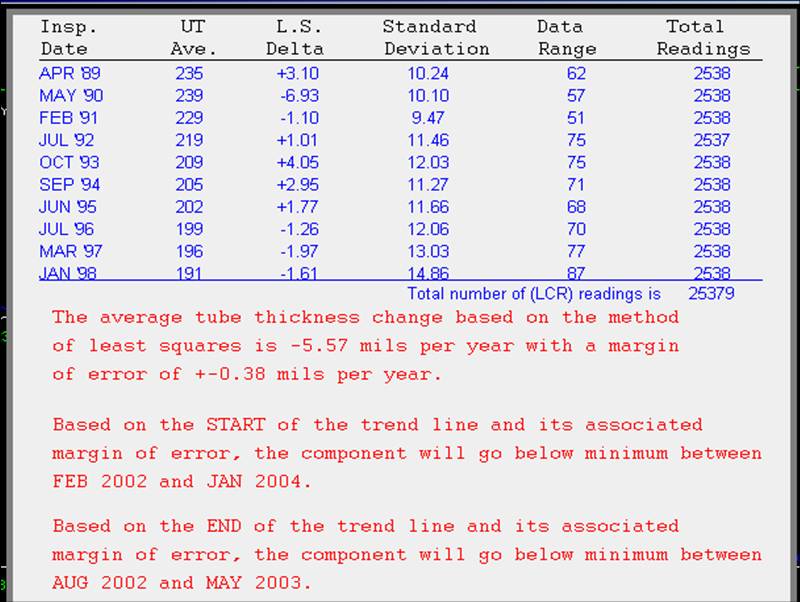
Un-Conditioned Data Least Squares line
- Notice the UT thickness averages for each of the inspection dates in the wear file.
Information for unconditioned data
- Notice the total number of readings before data outside of two standard deviations is removed.
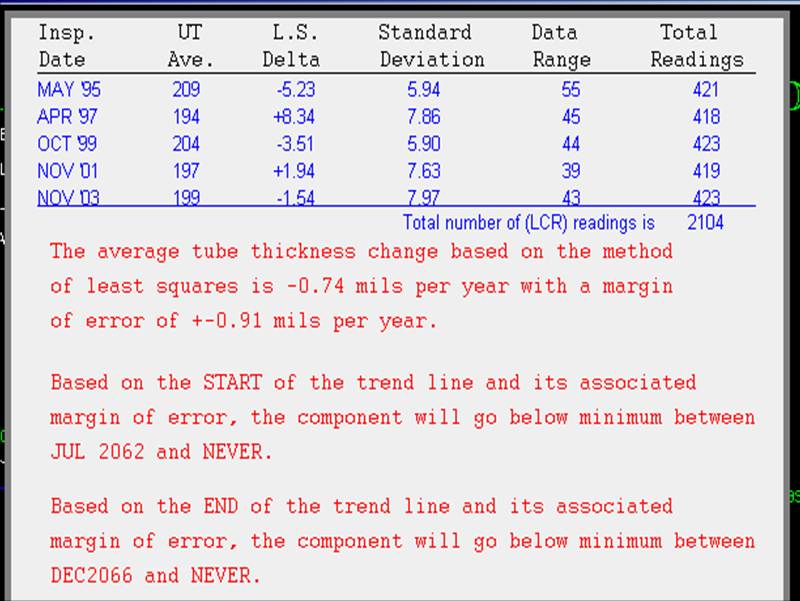
Conditioned Data Least Squares Line
- Notice now the average thickness is different for some of the inspection dates.
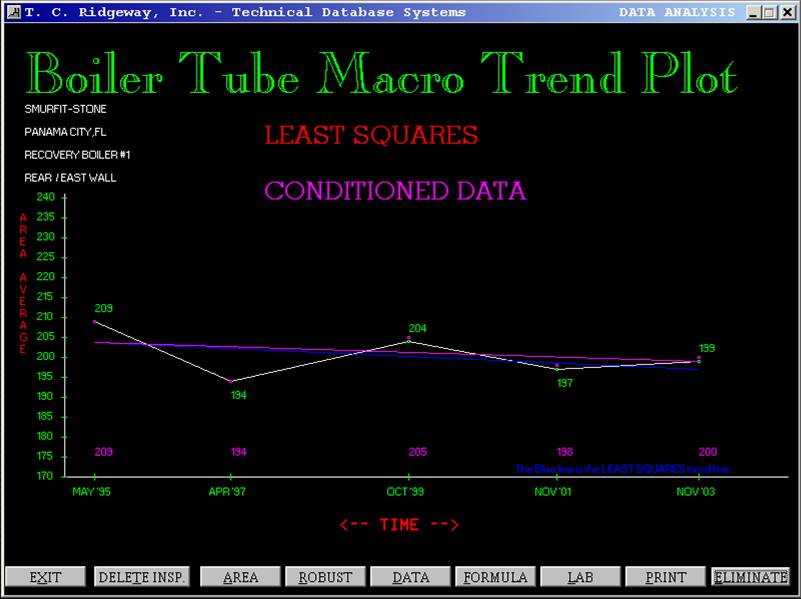
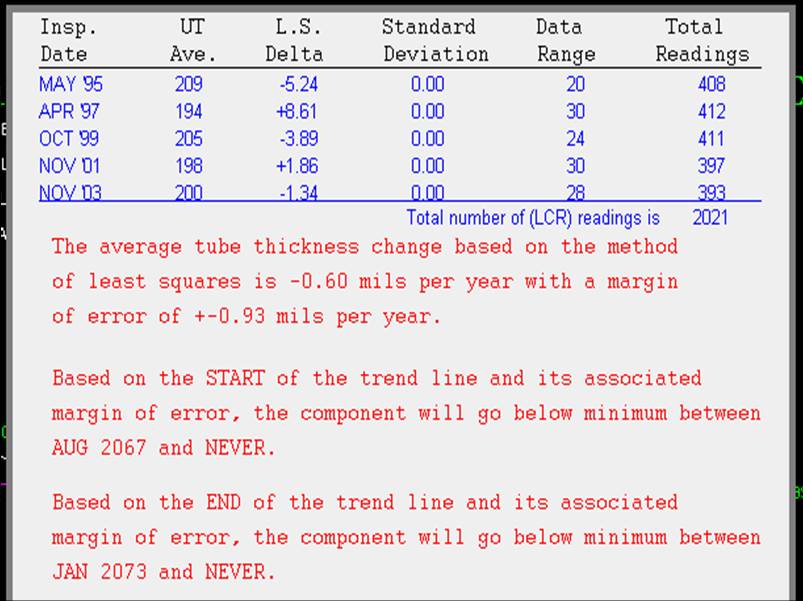
Information for conditioned data
- The number of readings being smaller means that some spurious data is gone. Also notice the rate of change is different than the un-conditioned data's rate.
Point-for Point Verifications
- During the daily shutdown meeting, it is not uncommon for someone to ask, "How does this year's data compare to the last inspection?'
To answer the question, the TDS generates a list of UT locations who's current data is
significantly different from the last inspection.
This list is referred to as the Verification List and is given to the lab so it can go back
into the boiler to gather a better set of data. Nothing can be done about the historical
data. However, a second look at the current data can be accompolished because the
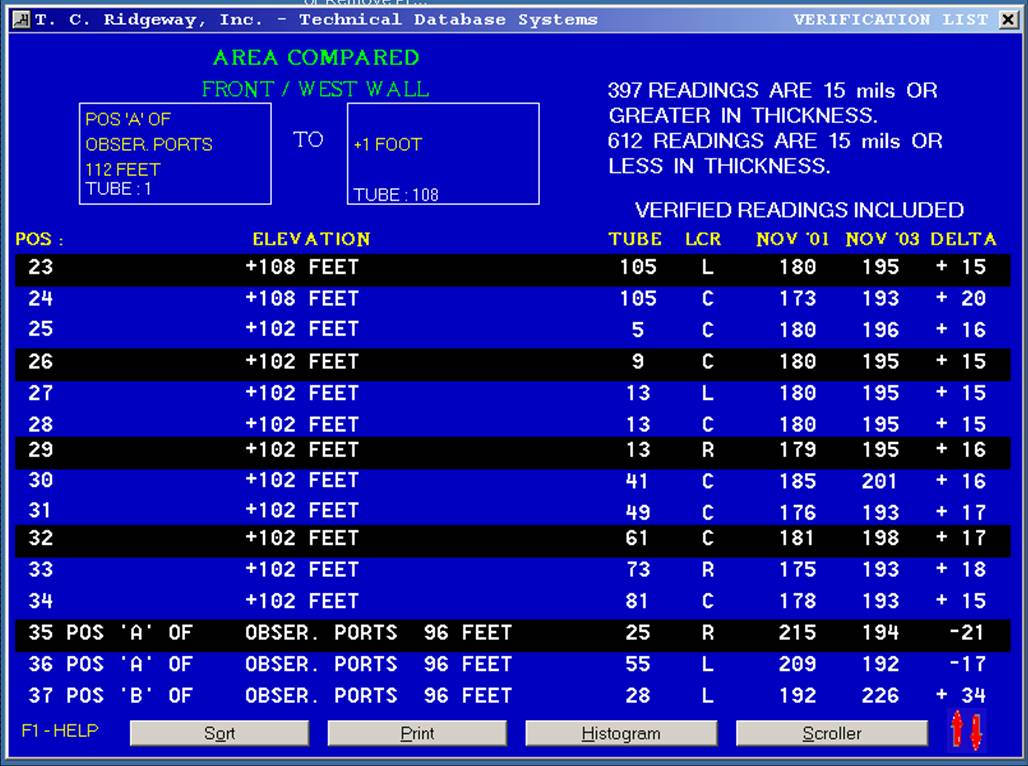
boiler is still down. The next screen, when printed, is the verification list the
technicians use to go back in for a second look.
On-Site Verification List
- Another tool to help get better data during the current inspection
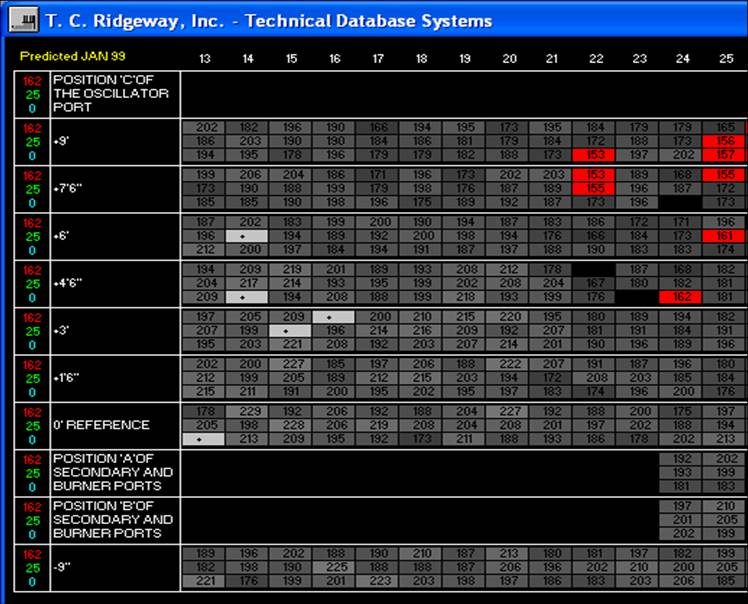
Future Image
- By having the current UT thickness value and the rate of change for each location, you can mathematically predict the future.
- By trending data from the Rate Image and specifying a future UT inspection date, the "Future Image" comes into existence.
- The future image is a concise summary of up to fifteen historical insepctions that can represent over 100,000 UT readings. At one glance, you can see the areas of the boiler that will be future maintenance problems.
- All of the analysis tools that apply to the current-data Static Image, also can be used on the future-data Static Image.
- Each test point's predicted thickness is assigned a color which reveals it's relation to the minimum allowable thickness. The darker the color, the closer the predicted tube thickness is to the miniminum allowable value. Any predicted value that is at or below the minimum thickness value is red.
Static Image of Future Data
- Those UT locations that are going to be below the minimum allowable thickness at the specified future date are displayed in red.
Future Image Data
- A "+" symbol on the future image indicates the data for a test point is getting thicker instead of thinner. We all know tubes do not get thicker. Therefore, something needs to be done during the acquisition of the data to improve the quality.
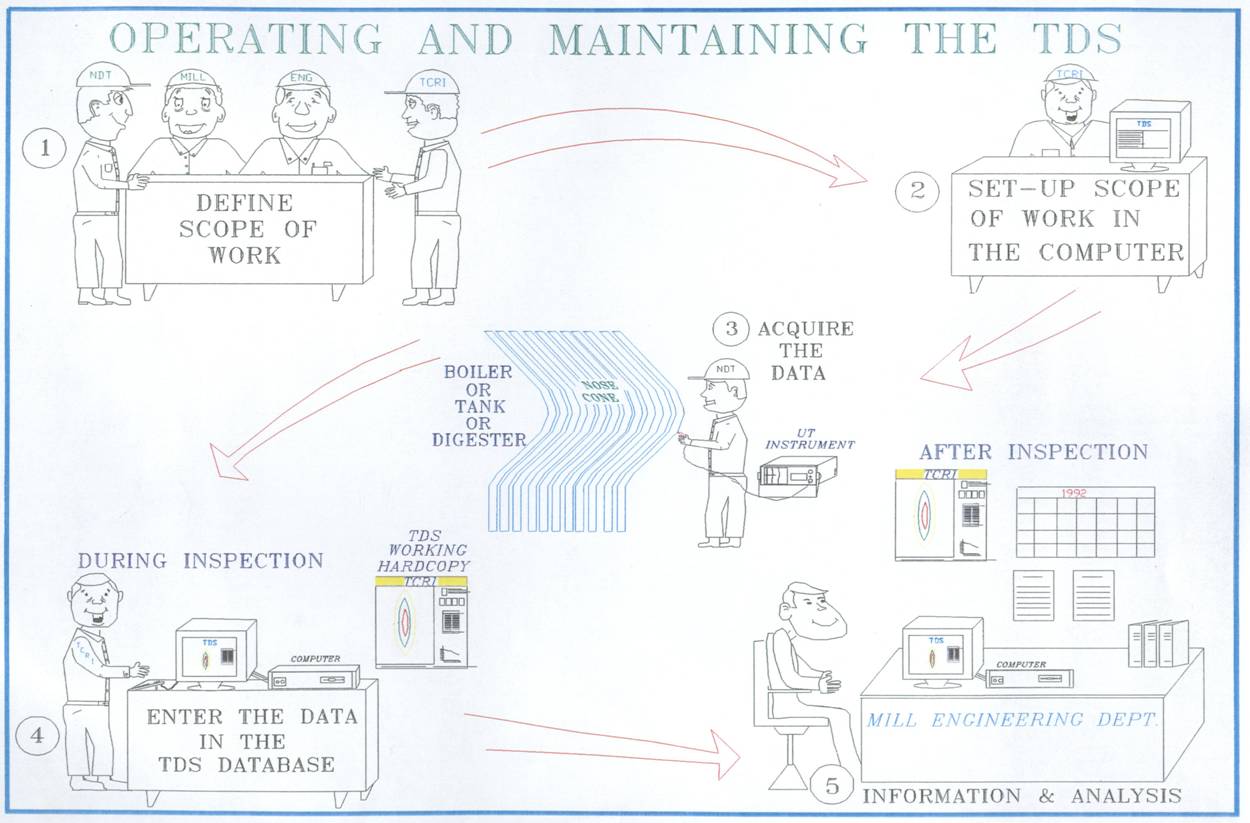
Using the TDS during Boiler Inspections
- Since September 1984, TCRI has gained expertise in processing and qualifying the UT data during the inspection. Real time "working copies" of the report are generated and displayed 24 hours a day throughout the job. This enables the lab to get additional readings while the manway is still open.
Acquiring the UT data
- The UT data can be manually entered into the database or TCRI can receive data files via diskette from the NDT lab.
- All major NDT labs and most small NDT labs are compatible with TCRI for data transfer via diskette.
- The TDS will communicate with the Panametrics and Krautkramer loggers.
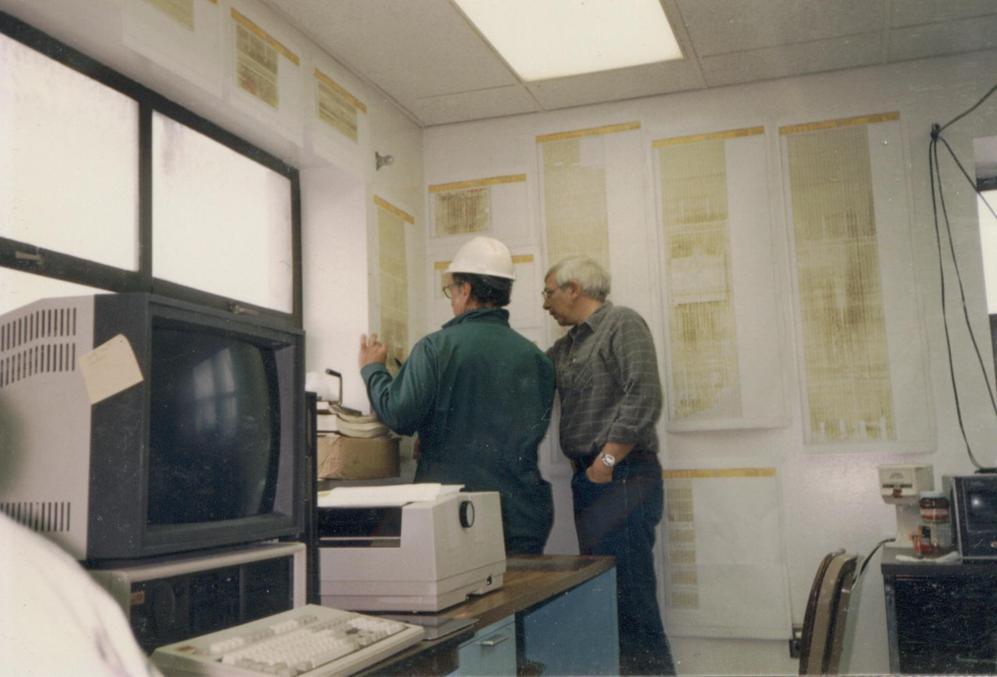
On-Site Working Copies
- The true value of the TDS is realized when the data is evaluated during the actual inspection.
- The data is collected from the NDT technicians, processed and then evaluated by the mill engineer.
- If data quality problems are detected, there is still time to correct them.
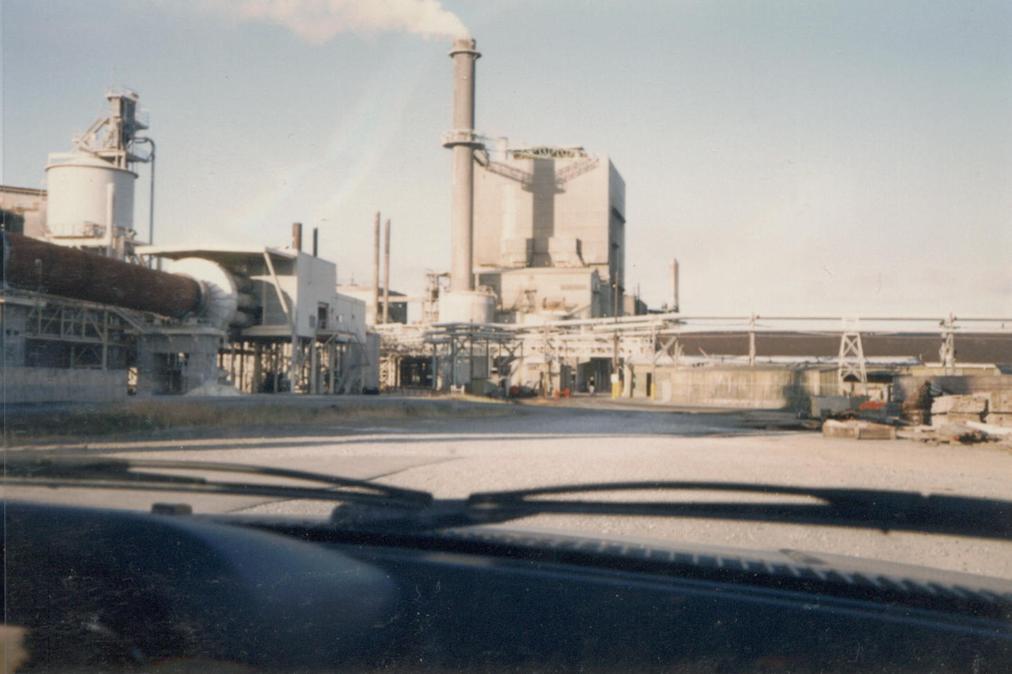
Arriving at the mill
Interfacing with the Lab
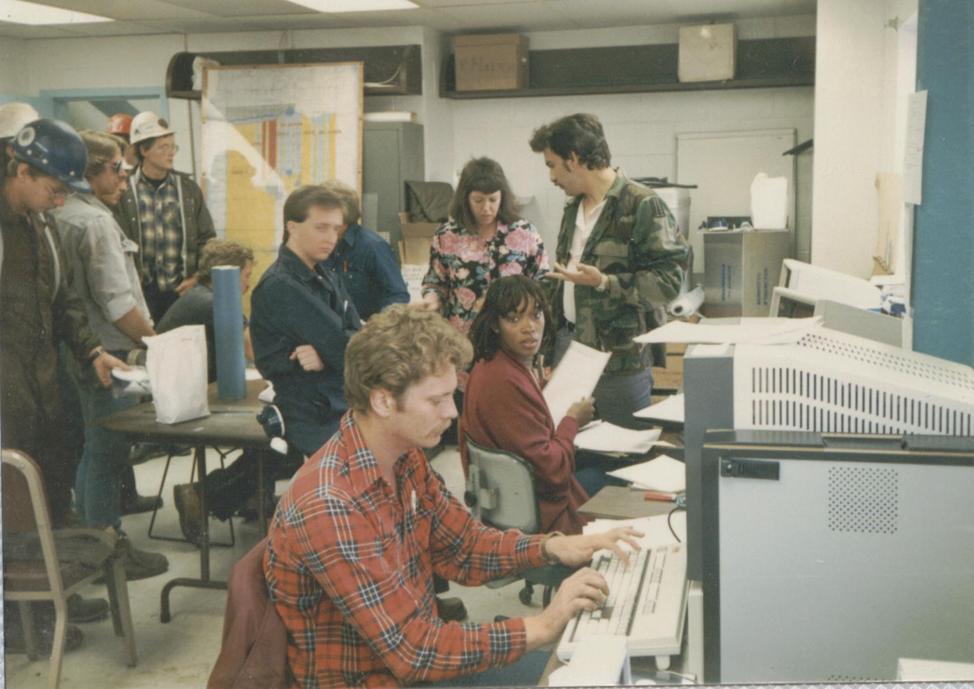
Mill engineer and NDT foreman evaluate the UT data by using the "working copies" of the report
A job completed and well done
Boiler Inspection Communications
- The following are not features of the softeware. They are suggestions based on observations made while developing the software. In order for the UT inspection to be a success, people must talk
Pre-inspection communications
During-the-inspection communications
Post-inspection communications
Overall flow of Info
Pre-Insepction Communications
- Prior to actual inspection, it would be helpful if the mill would review the historical reports and specific mill guidelines to establish the scope of work. The scope would become well defined by using drawings and narratives for each section of the boiler.
- Other areas that could be discussed and documented before the inspection are: tube specifications-type of material, nominal and minimum wall thickness, UT inspection schedule, mill safety requirements, NDT technician training and qualifications, NDT equipment to be used, on-site procedures and documentation, mill and lab responsibilities.
- All of the items previously mentioned should be placed into one comprehensive bid package by the mill engineer and dispersed to the NDT labs for bidding purposes.
- This process ensures the labs know exactly what they are bidding on and increases the probability of a successful inspection.
During-the-Inspection Communications
- The communication flow at this time is primarily between the NDT lab and TCRI. By receiving data from the NDT lab throughout the inspection, TCRI generates up-to-the-minute Working Copies of the data. This enablesall quesronable data to be verified and re-inspected if necessary.
During-the-Inspection services offered by TCRI
- Verifying the accuracy of the boiler inspection orientation drawings
- Verifying the inspection is being conducted according to the orientation drawings.
- Collecting NDT technian certifications from the lab and comparing them to ASNT recommended training guidelines.
Post-Inspection Communications
- If the engineer has the TDS installed on the mill's computer system, we will send a CD backup of the inspection report.
- This allows the engineer to archive the UT data and use the software to plan for the next maintenance shutdown.
Advantages of using the TCRI TDS Boiler Report
- Enables the mill engineer to make better decisions faster, during the inspection.
- Provides consistency in UT data reporting, regardless of which NDT lab performs the inspection, the mill will receive the same report from the TDS. A consistent presentation of data saves time and reduces confusion during the data analysis.
- Displays the proper inspection orientation by using multiple drawings.
- The ability to display entire boiler sections on a single print by utilization of a "Thickness Legend" for the UT data.
- Reveals true wear patterns and qualifies the data by using image processing techniques.
- Long-term trending as mentioned in the Recovery Boiler Reference manual published by the American Paper Institute (API), October 1979.
- If your UT data is of high quality, the TDS can predict the future. If it is not, the TDS will let you know.
- Visual trending (comparing historical prints to visualize wear patterns developing).
- Mathematical trending (actually taking the data, point for point and calculating wear rates).
WHY TCRI ?
- There are imitators and duplicators. TCRI is the only company that has this type of reporting software and by design is NOT an NDT lab. We enable the mill to work with various NDT labs and still get the same type of QA and report on each inspection.
- TCRI will deliver unbiased trending reports of your boiler UT data !
? ! # * & @ !!
- If you have experienced problems making sense of your NDT data, then you know what we mean when we say.....The lab performing the inspection and submitting the only report is a conflict of interest occasionally !!
Specifications and Business Information
- The TDS is Windows based and runs on the latest operating systems.
- Will run on your Windows LAN. Simply map your drives and the TDS can access them.
- Uses AutoCAd to create new drawings. UT data analysis and print routines do not need AutoCad to operate.
- No up-front fee for the TDS license. A simple monthly fee while you use the software to maintain the database of your boiler inspection data.
- License is site specific and may be installed on as many computers at the mill as needed.
- The software is being maintained and is constantly evolving. Updates come automatically as a result of the licensing agreement. There is no additional charge for updates.
- 8.5"x11" and 8.5"x14" and 13"x19" print sizes, all of which can be printed as the Legend or Lowest Reading format.
- TDS operator training class is a two-day class held at the mill or in Charleston.
- No charge for initial TDS training of mill engineers if class is held in Charleston.
- A small student training fee for a training class after the initial class.
- No charge for telephone tech support.
- To have TCRI perform QA services on-site during the boiler inspection, fee is based on length of shutdown and travel costs.
Conclusion
- The TDS is the result of 25 years (as of 2010) of blood, sweat and tears. The experiences gained from hundreds of shutdowns, dozens of engineers and dozens of NDT labs have made it what it is today. It does a superb job of helping you understand your UT data and does far more than what was just presented. We desigened it to be installed at the mill where it would be used as a technical tool and record keeping facility. The UT analysis routines are for budget and meintenance planning. The industry asked for it, so we built it. We would love to be at your next shutdown helping you with the numbers.
Thomas C. Ridgeway